Parachute Folding
Figure 1: Initial Steps Slide

Figure 2: Slide 2

Figure 3: Prepping for Break Line

Figure 4: Break Line

Figure 5: Z Folds

Figure 6: Triangle

Figure 7: Triangle Continued

Figure 8: Square

Figure 9: Deployment Bag

Figure 10: Bag Continued
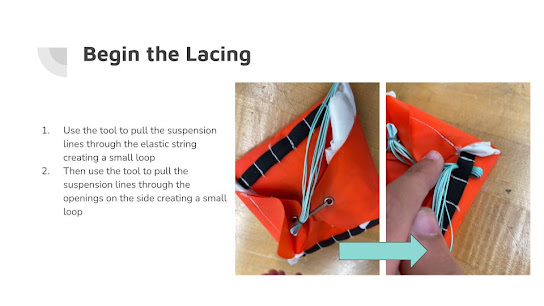
Figure 11: Lacing

Figure 12: Lacing Continued

Figure 13: Finalized Project
Bramor Mission Planning

Figure 1: PWA Mission 1st Example

Figure 2: PWA Mission Example 2

Figure 3: Uncertainty Landing Area

Figure 4: Updated Uncertainty Landing Area
Field Report 1
Figure 1: Picture taken from POV of the Catapult

Figure 2: Aircraft Seconds before landing in the Tree Line (Actual resting point not shown)
Field Report 2

Figure 1: Flight Crew 1 Setting up the Catapult

Figure 2: Kestrel Temperature

Figure 3: Flight 2 Summary
Crew Resource Management

Figure 1: Pre-Mission Role Breakdown
 Figure 2: Pre-Flight
 Figure 3: Post-Flight
ArcGIS Online

Figure 1: Urban Density Map of the DC Area

Figure 2: Houston Hurricane

Figure 3: Red Deer Recreation Centers

Figure 4: 3D Scene of Portland
ArcGIS Earth

Figure 1: NVDI Map

Figure 2: Infrared - USA NAIP

Figure 3: Thermal Hotspots

Figure: 4 US Wildfire Activity
Field Report 3

Figure 1: Failing Com Box Battery
Field Report 4

Figure 1: Data Storage Selection

Figure 2: Image taken at 100ft

Figure 3: Taken at 400ft

Figure 4: Image with shutter speed at 1/8000 setting

Figure 5: Screenshot of Tablet while adjusting the shutter speed to 1/800

Figure 6: Picture with shutter speed at 1/800
Field Report 5

Figure 1: Thermal view of a person hiding

Figure 2: Picture Taken of the two Pursuers

Figure 3: Person Hiding in Creek bed

Figure 4: M210 Launch Point


